By Balint Kovács
In this blog, Balint Kovács, who is an assistant Research Fellow at the HUN-REN-PE Evolutionary Ecology Research Group, explains how social networks in ant colonies are structured and influenced by different castes. His latest work in Social Insects can be read here.
How do the animals maintain connections? What do these connections look like? What shapes them? These are the basic questions posed by a generalist network scientist. When we talk about social animals, sooner or later, we arrive at the ant colonies. Ants are famously and extremely social, and many tales and stories highlight their industriousness and diligence. But what are the real facts? How can we describe these communities scientifically? My passion for social animals led me to investigate this question during my research work and PhD studies. I researched multiple animal species in the context of social networks, and of course, ants had to be one of them. Let’s see what we found in our observations.
In human societies, different jobs and workplaces create different microcultures and behavior patterns. But what about ants? Do different work tasks (castes) create different roles for individuals? If we look closely at these castes, what will we find?
Our research used a previously published paper (Mersch et al., 2013) about carpenter ants (Camponotus fellah). In this research, three main castes were defined:
Nurses: individuals who spend most of their time near the core of the nest. These workers guard and take care of the eggs.
Foragers: these individuals are responsible for gathering food. Most of the time, they search for resources for the colony.
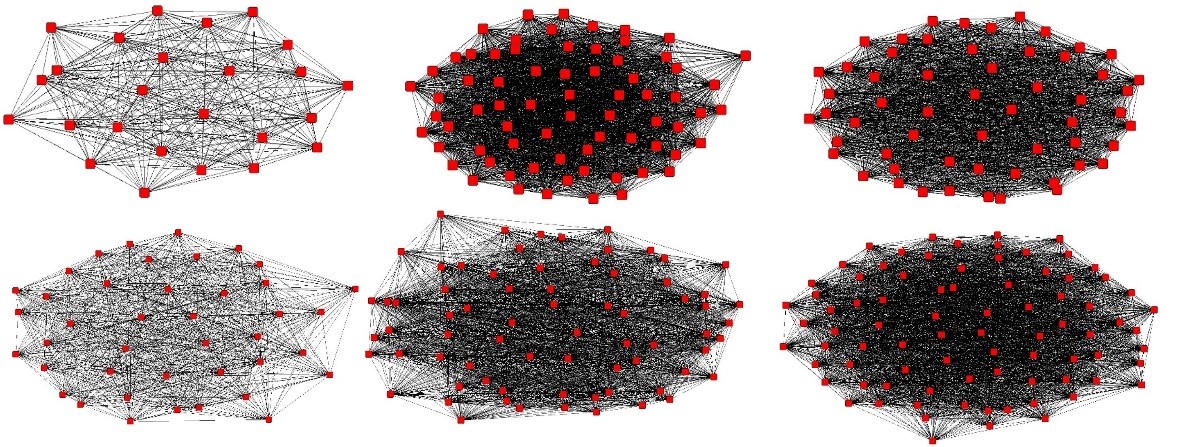
Cleaners: their responsibility is to clean the nest and maintain tunnels. So, we have castes and queens. Now, we need to examine their connections. Mersch et al. tagged and tracked all individuals for approximately a month in six colonies of these ants to detect interactions among individuals. More specifically, they observed when two individuals touched each other with their antennas. We used these interactions to create networks. In these networks, or graphs, the nodes were the individuals, and the edges represented the interactions. So, we have nodes (ant individuals) and edges (interactions between them). With this information for each day, we can model networks for each day as well. A whole network for six colonies in one day looks like this:

Too many edges, too many nodes. Quite chaotic. Our idea was to model networks only for castes.
Nurses:
Foragers:
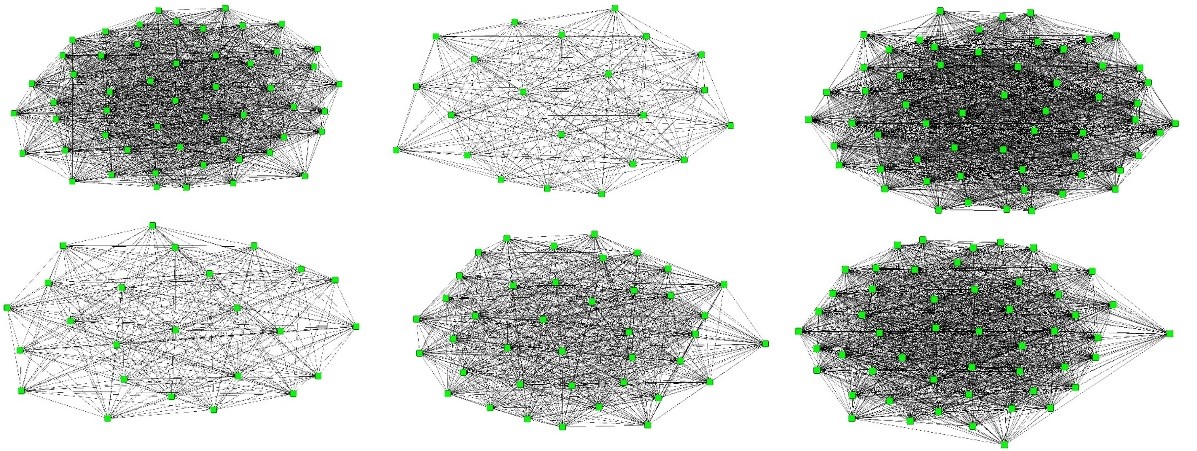
Cleaners:
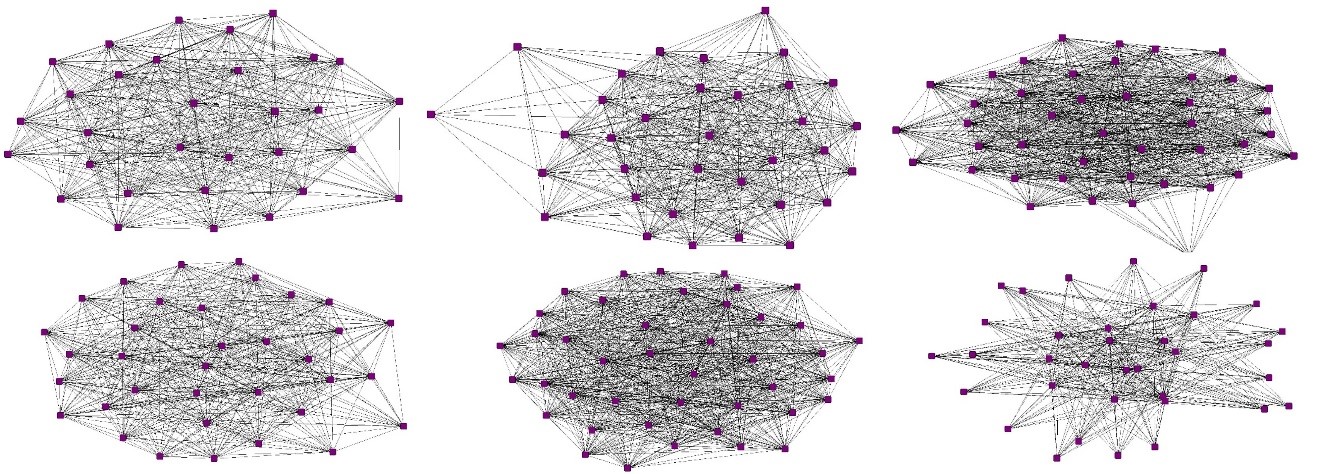
Okay. Now we had networks for each colony, each day, and each caste. Almost done. But we had another idea as well: What about the queens? What if the individuals’ networks looked different when they interacted directly with the queen? To investigate this question, we modeled another two types of networks: Queen-related and No Queen-related networks. To distinguish these additional “castes” of individuals, we called the subnetworks.
Queen-related:

No Queen-related:

Now we had all that we wanted: interactions, castes, and subnetworks. The last step was to compare these networks to each other to see the basic differences between networks and, therefore, the differences in behavior among these worker groups.
But how is this possible? Visually, we can see some differences, but we need to prove it. In network studies, we use network indices to describe network properties. Every index tells something about the group we modeled. Multiple indices are available in the literature; here we used three basic indices: Network Centralization Index (NCI), Clustering Coefficient (CC), Average Path Length (APL), and Small-World Index (SW). NCI gives the hierarchical properties of a group, CC is an indicator of the rates of cliques within the group, APL calculates the average “step” (network edges) between all individuals, and SW represents how many “neighbors” are required to reach everyone within the group. In other words, NCI represents the hierarchy rate, CC shows how easily information can flow through the group, APL calculates the “speed” of this information flow within the group, and SW shows how “closed” the group is.
We used a statistical method (Linear Mixed Models, LMM) to compare these indices between castes and subnetworks. The results showed that Cleaners are less hierarchical (low NCI), with fewer cliques (low CC) than Foragers and Nurses, with slower information flow (high APL).
The presence of the queen surprisingly influenced only the information flow. Those individuals who were connected with the queen established “faster” networks than individuals with no queen connections.
In summary, our results revealed new information about castes and individuals through their networks. It seems like the tasks of nursing and foraging require a more centralized, denser, and faster information flow than the cleaning task. Moreover, the presence of the queen makes information flow faster within the group. So, the role of the queen seems essential not only for producing offspring but also for “controlling” the castes as well.
Cited article:
Mersch, Danielle P., Alessandro Crespi, and Laurent Keller. “Tracking individuals shows spatial fidelity is a key regulator of ant social organization.” Science 340.6136 (2013): 1090-1093.
